WESTERN WASHINGTON TECTONICS AND FAULTS
This informal web page was designed to discuss key tectonic features of western Washington that are of significance in evaluating earthquake hazards.
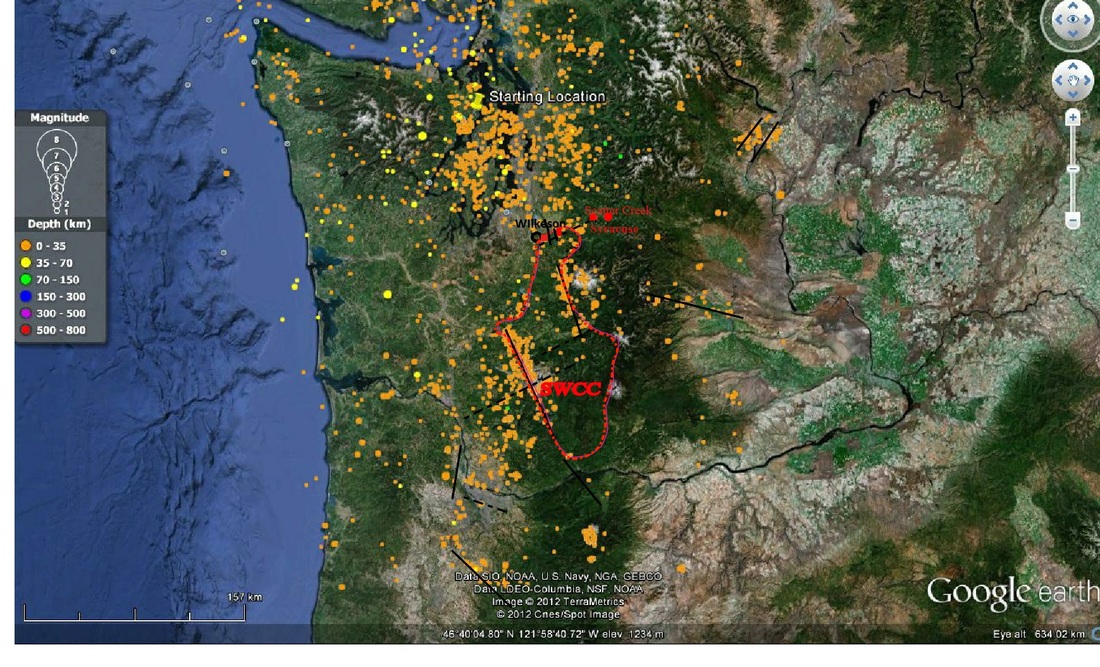
Figure 1a--Western Washington seismicity with SWCC feature which controls the western Rainier seismic zone (WRZ) and St. Helens zone (SHZ). Two distinct seismicity zones are apparent (1) that associated with the volcanoes and SWCC and (2) Puget lowland constricted seismicity concentrated north south in the region around Seattle.
A very restricted zone occurs east of the Cascade region in the Entiat area near the M7+ 1872 earthquake hypocenter.
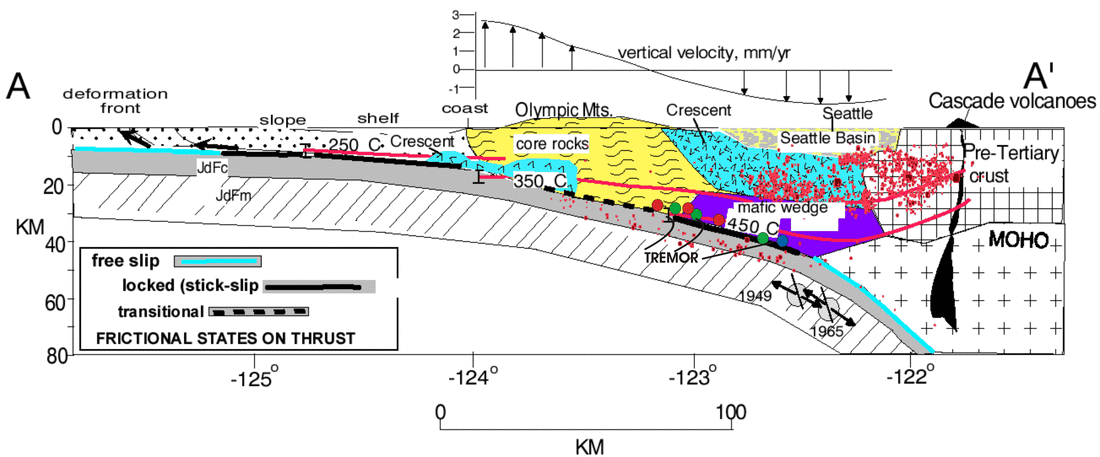
Figure 1b--Subduction zone section based upon earthquake tomography of Stanley, VIllasenor, and Benz (1999).
PART A--Discussion of nature of White River-Naches fault zone
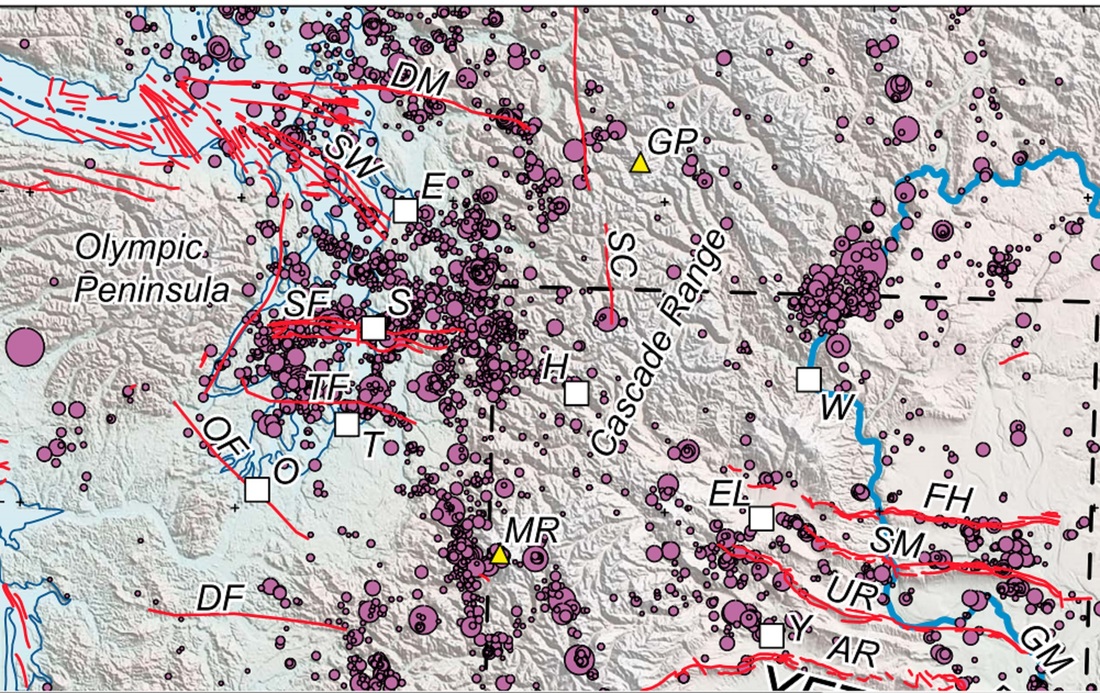
Figure 2--Seismicity plot from Blakely et al., 2011
Figure 2--Seismicity plot from Blakely et al., 2011. SF=Seattle Fault, TF=Tacoma fault, MR=Mt. Rainier, DM=Devils Mt. fault, EL, FH, SM, UR, AR, GM=Yakima fold belt anticlines, W=Wenatchee, OF=Olympia fault. In Blakely's plot the quakes associated with the east end of the Tacoma fault almost appear to turn south toward the WRZ west of Mt. Rainier, but Blakely attempts to connect the eastern TF with the Yakima fold belt using the White River fault zone as shown in the figure 3a below.
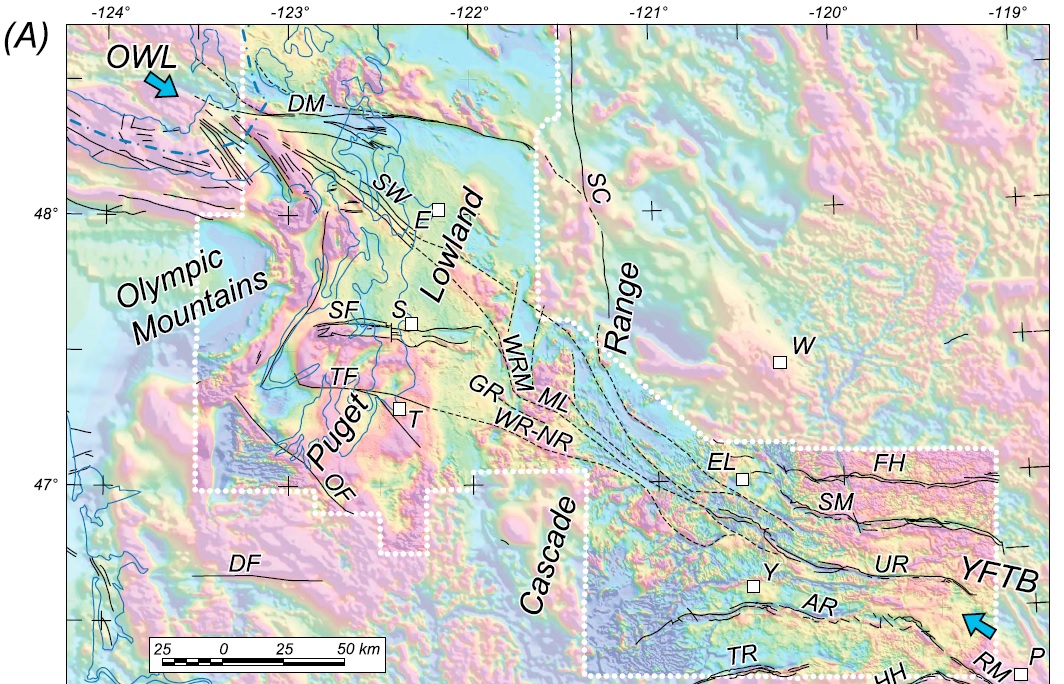
Figure 3a(above)--Aeromagnetic data interpretation from Blakely et al. 2011. Shown is the attempted connection of the Yakima fold belt (UR fold in particular) to the White River and Naches fault zone zone (WR-NR) to the east end of the Tacoma fault zone. But the question arrives first concerning the White River fault existence and significance discussed below. And there is no anomaly in the magnetic data that supports the existence of a feature such as the White River fault.
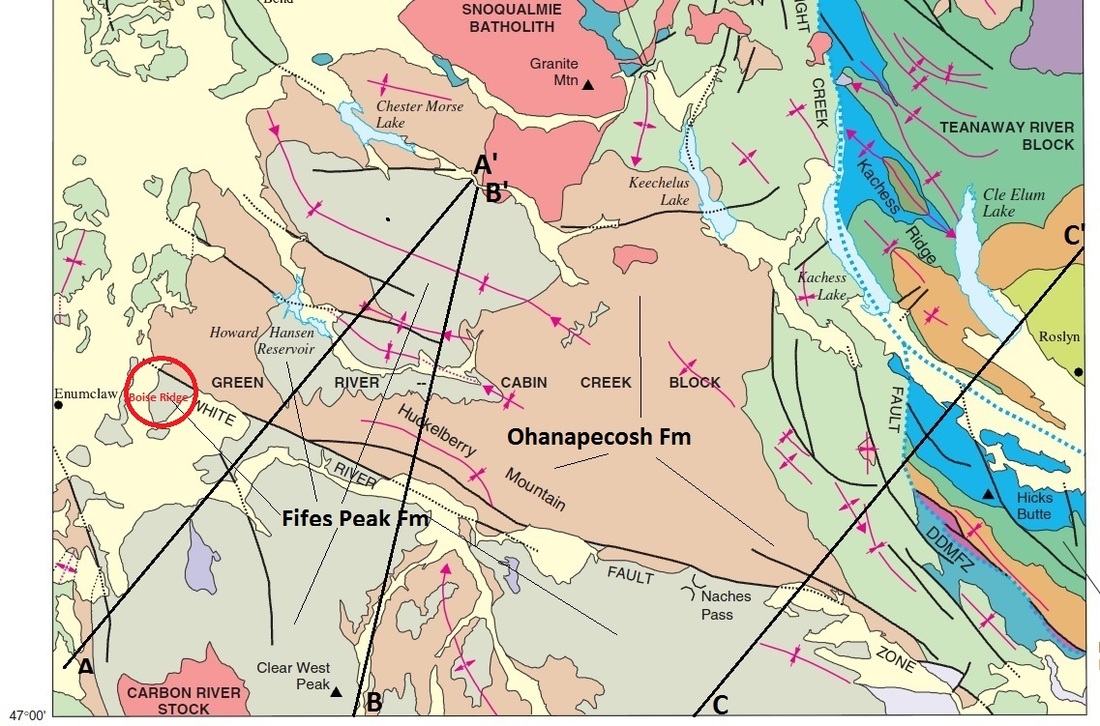
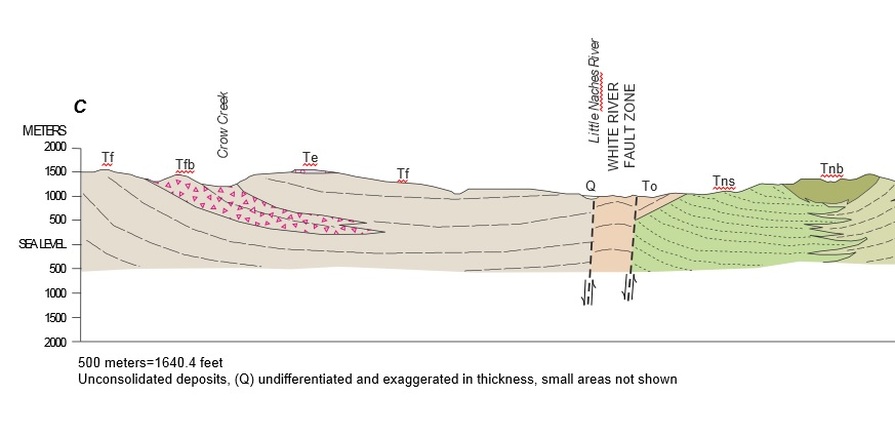
Figure 3b--Geology from Tabor et al. (2000). Cross-sections along profiles AA', BB', and CC' are discussed near the end of this presentation on figures 15-17. For now we will only discuss the solid line representation of the supposed White River fault across Boise Ridge just east of Enumclaw, WA noted in the figure by the red circled area.
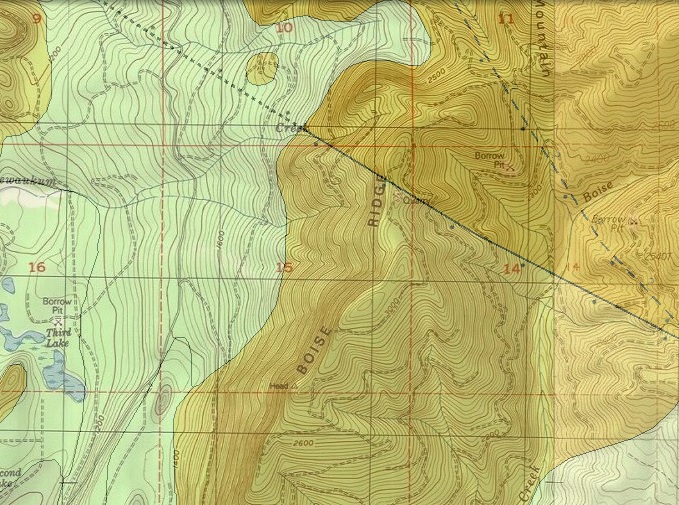
Figure 4--Geology of the Boise Ridge section of the White River fault near Enumclaw WA(from DNR online geology:( http://www.dnr.wa.gov/researchscience/topics/geosciencesdata/pages/geology_portal.aspx) . Tan color represents areas of Ohanapecosh Fm. and pale green/tan units are Fifes Peak Fm. The solid line represents the interpreted White River fault with Fifes Peak formation units on the SW side and Ohanapecosh units on the NE side. The north fork of Newaukum Creek heads up at the NW end of the White River fault before it disappears under the alluvium west of Boise Ridge.
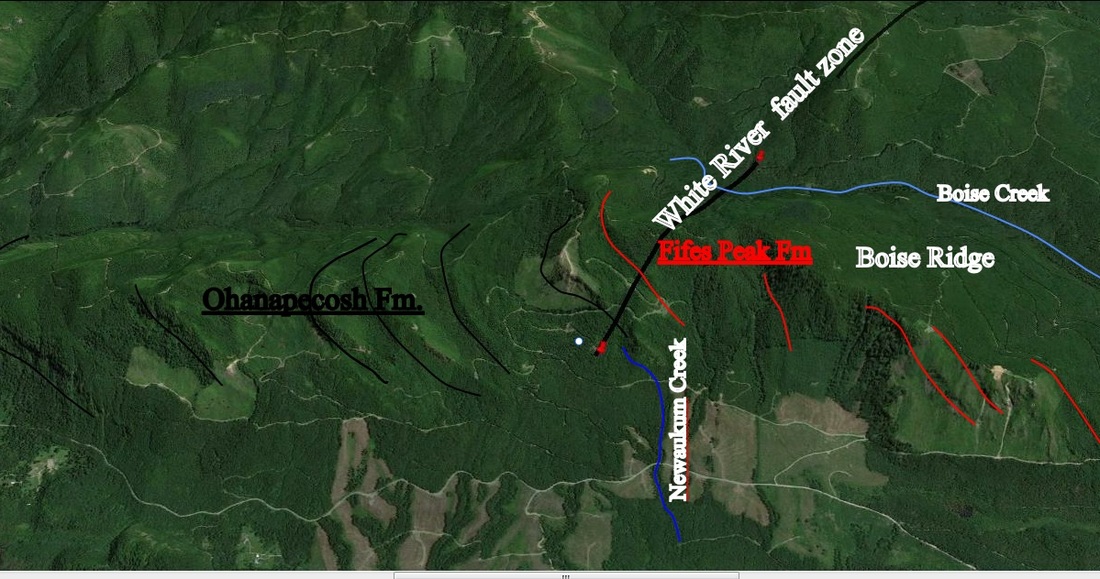
Figure 5a--Google Earth view of Boise Ridge with south dipping beds of Ohanapecosh shown by black lines and south dipping beds of Fifes Peak formation shown in red. The assumed surface outcrop of the White River fault is shown by the solid black line with red pins at each end. Boise Ridge appears to be a narrow south dipping anticline due to compression between two Tertiary intrusive zones as shown in the figure below. We have looked at possible ground truth near the headwaters of Newaukum Creek, but did not find good outcrops to study the fault.
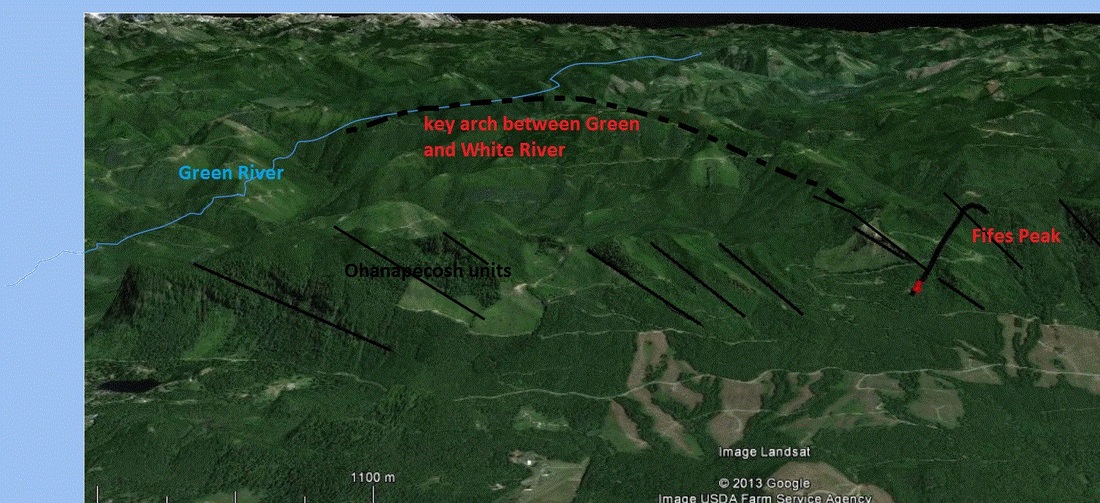
Figure 5b--Overhead view of area in 5a showing the main arch between the Green and White Rivers which controls structure just east of the Boise Ridge area.
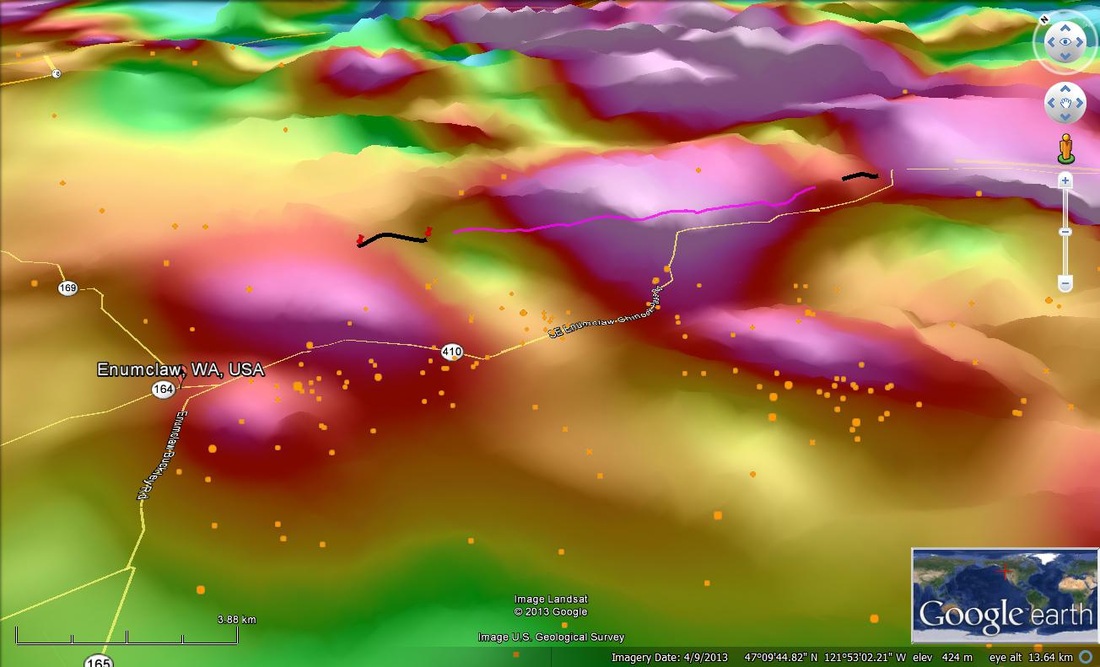
Figure 6a--Aeromagnetic data in the Boise Ridge/White River fault (WRF) area is shown above from USGS data compilations. Because of input to Google Earth (GE), the fault appears to be floating. The black portions denote where Tabor and others show the WRF as a solid line and the magenta portions are where the WRF is shown as dashed. The colored aeromagnetic data (red is high) input to GE reveals a probable Tertiary intrusive body just east of Enumclaw and the southern end of a major intrusive system associated with the older Tertiary Cascades arc on the east side of the red pinned, solid line which denotes the western end of the White River fault. Orange dots are earthquake surface locations. More discussion of the White River fault location and nature are contained at the end of this web page.
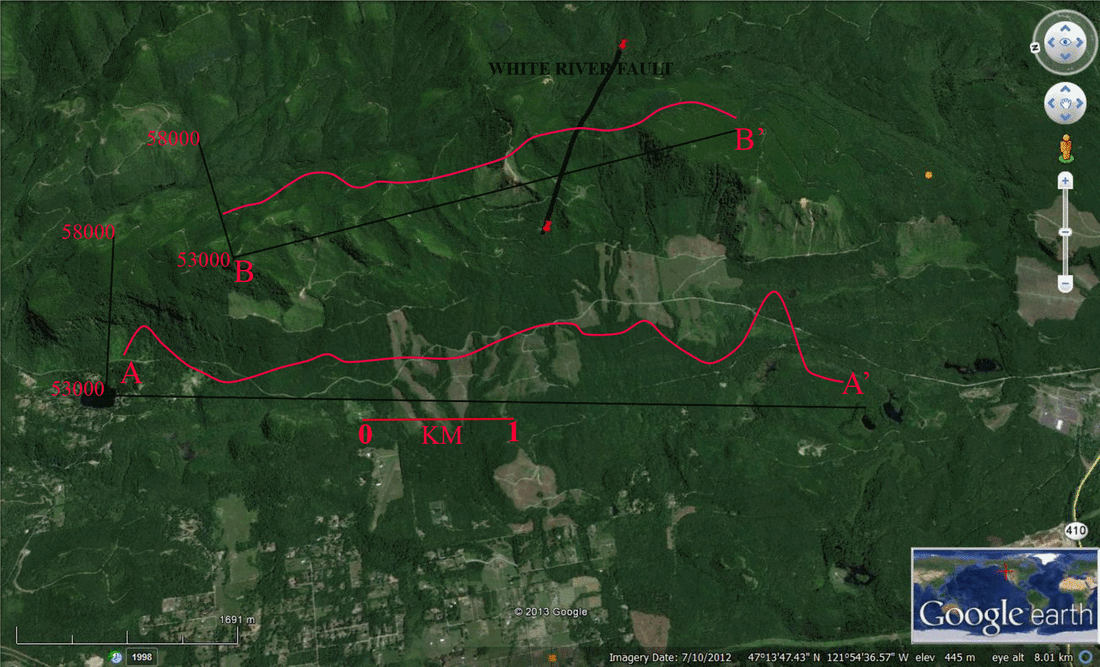
Figure 6b--Two ground magnetic profiles were made down the Boise Ridge area. Vertical values are in nanoTesla (nT). The first profile, AA', followed the old Weyerhauser road just west of the mapped end of the White River fault (WRF). This profile shows only one feature of interest which is the high of several hundred nT near the A' end (south end). This is probably a spur of the fairly large intrusive body indicated in Fig. 6a just east of Enumclaw. The section of profile north of the WRF has somewhat lower values, but there is no indication of a sharp contrast or altered zone associated with the WRF on either AA' or BB'. The profile BB' crosses the mapped trace of the WRF.
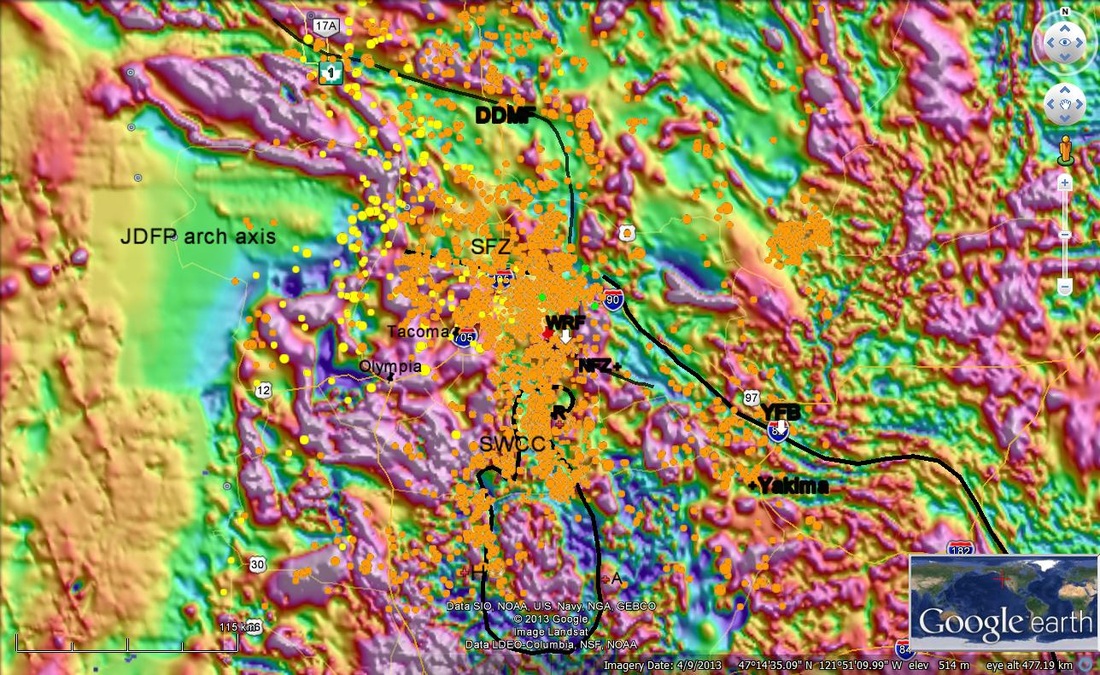
Figure 7a--Washington aeromagnetic data from the USGS inventory. Highs are red and lows are blue. The SWCC feature (Southern Washington Cascades Conductor) is indicated, as are the Seattle fault zone (SFZ), the Yakima fold boundary (YFB), WRF (White River fault) as connected to folds near Yakima by Blakely et al. (2011), Darrington-Devils Mt fault zone (DDMF) and the Juan De Fuca plate (JDFP) arch axis.
Note that the WRF and Naches fault designated path cuts right across magnetic highs with no apparent expression in the magnetic data. It is quite clear from the magnetic data that we present that the more logical connection between the Columbia Plateau region and Puget lowland is the axial part of the Yakima fold belt boundary which extends from northern Oregon (Wallula gap) to the area of intersection with the eastern Seattle fault and southern end of the DDMF. This trend follows the outline of the early Columbia rift/embayment developed during the initial Columbia River basalt flooding the region. What we refer to as the Yakima fold belt/boundary has been designated as the Cle Elum-Wallula lineament by others, but the use of the YFB term fits the tectonic evolution of this system more appropriately. For instance the attempt to connect the Yakima local region finger folds to the Tacoma fault using a hypothesized White River fault continuous zone would have to cut through NS aeromagnetic anomalies associated with the Snoqualmie batholith and other intrusions of the Tertiary Cascades where detailed data show no offsets. The Yakima fold belt boundary occurs on the south side of older accreted terranes which the Columbia River basalts (CRB) covered. This backstop is responsible for the wrinkled nature of the CRB in the aeromagnetic data and to a lesser extent, in the topography. To illustrate this older accretionary backstop, we have reproduced the figure below by Ray Wells adapted from the USGS web site at http://geomaps.wr.usgs.gov/pacnw/graphic/e.gif The red line on Figure 7b below represents our 'YFB' path on the remainder of the figures in this web page and also clearly shown in the aeromagnetic data.
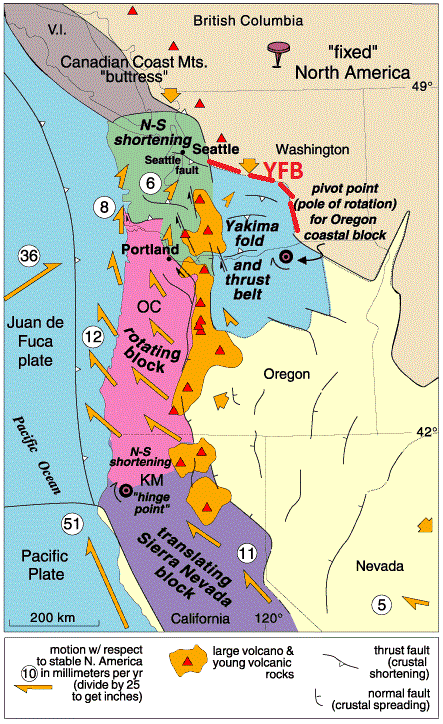
Figure 7b--Regional tectonics from Wells et al with our boundary zone interpreted from the aeromagnetic data and informally designated the 'YFB' which could be interpreted to mean Yakima fold belt boundary, at the southern margin of the older accreted terranes.
PART B-Nature of Olympic Wallowa Lineament and Yakima Fold Boundary
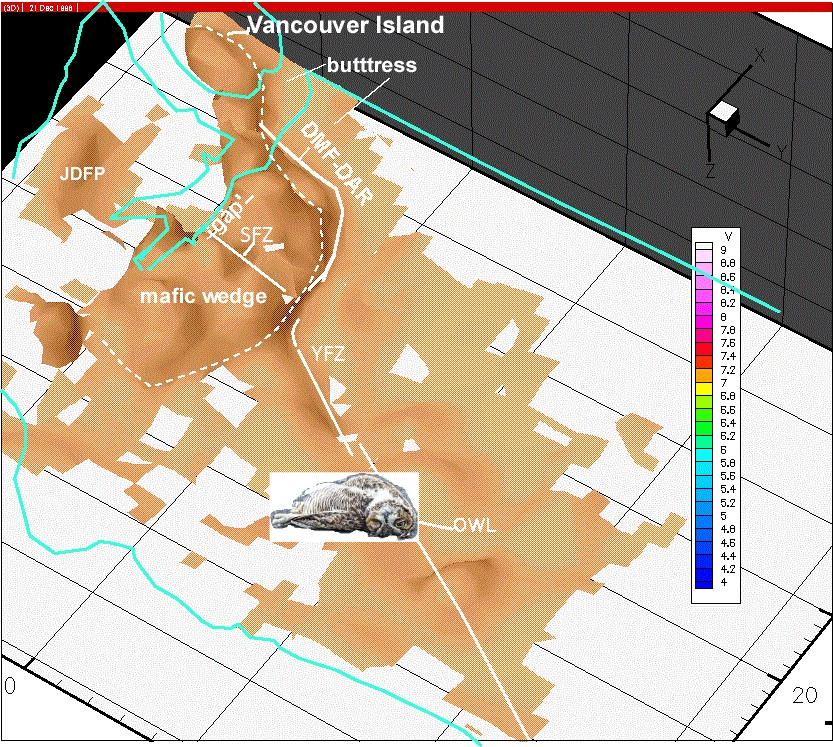
Figure 8a--Regional isovelocity surface (7.0 km/s) from earthquake tomography of Stanley, Villasenor, and Benz (1999). High velocity buttress north of the DDMF is indicated, along with the location of the SFZ, and the mafic wedge found in the seismic tomography and shown below. There is a 'gap' between this mafic wedge and the mafic rocks sitting on top of the JDFP. This gap provides the primary control for location and structure of the Seattle basin and the south dipping SFZ is located on the north side of the mafic wedge. More details are shown in the Fig. 9 below. A linear low in the isovelocity surface extends from near the intersection of the SFZ with the DDMF to the southeast toward Yakima. This corresponds to aeromagnetic and tectonic boundaries which we refer to as the YFB or YFZ in other figures and forms the northern margin of the deformed Columbia Plateau volcanic province. The 'OWL' feature is not defined in the tomography or the aeromagnetic data as a straight line zone as shown by Raisz (1945) who described its possible existence between the Olympic Peninsula and Wallula Gap. The lineation discussed by Raisz and by others in later publications can be readily explained by the crustal lineations and alignments suggested by our tomographic, aeromagnetic, and tectonic models, which follow well defined geologic boundaries, but not in a super straight line. The OWL seems to have gained new popularity on illustrations from a variety of authors, but we think it is time to kill the OWL and talk about the real structures that exist and do not align with Raisz's lineament or many others proposed such as the connection of the 'White River fault' to the Tacoma fault. Also indicated is the YFZ (Yakima fold zone or belt axis), shown on other figures as YFB. Therefore the OWL is dead in the illustration.
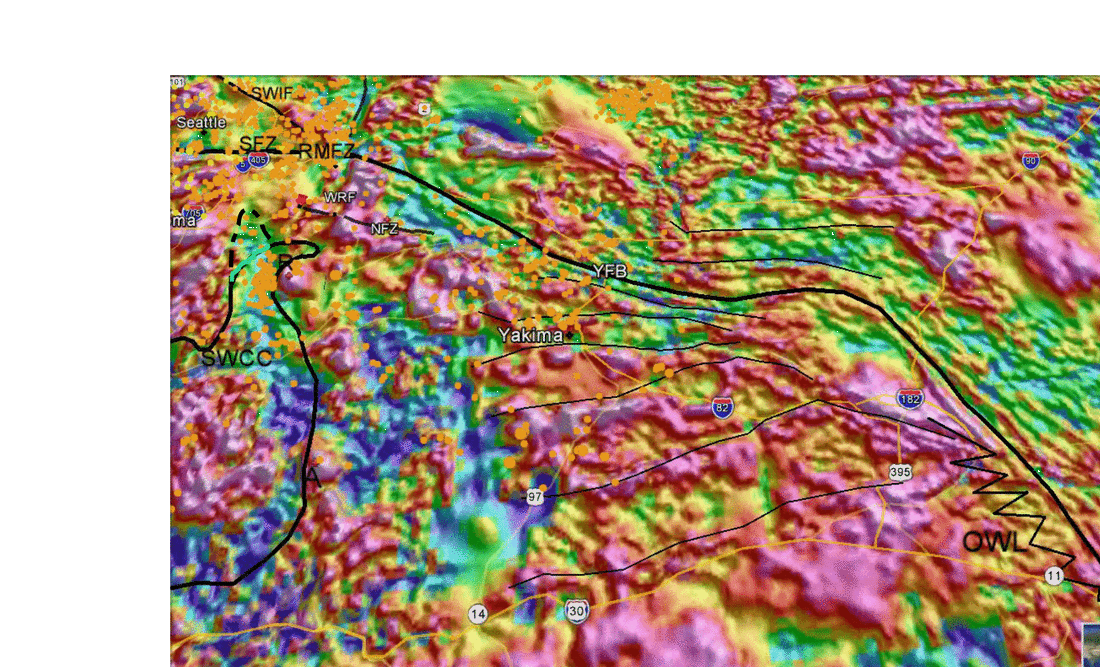
Figure 8b--Detailed aeromagnetic data in the Yakima region with fold 'fingers' trending mainly EW (light black lines). These topographically evident fold 'fingers' such as the Toppenish Ridge, Horse Heaven Hills, and Yakima Ridge trend EW because of the north directed compression against the pre-Tertiary backstop further north. They merge into a NW shear zone on the east ends that parallels the YFB and the cause of the early definition as the OWL (zig zag area is the only real unique tectonic feature) by Raisz (1945). The YFB boundary or tectonic margin of the Columbia Plateau folding is related to the backstop of older accreted crust to the north. It appears there may be a significant intrusive body that also pushes the east end of the folds together centered under the I-182 symbol just north of the end of the zig-zag line. Note again that the interpreted White River/Naches fault zone cuts right through magnetic highs associated with the southern end of large scale Tertiary intrusion complexes like the Snoqualmie batholith.
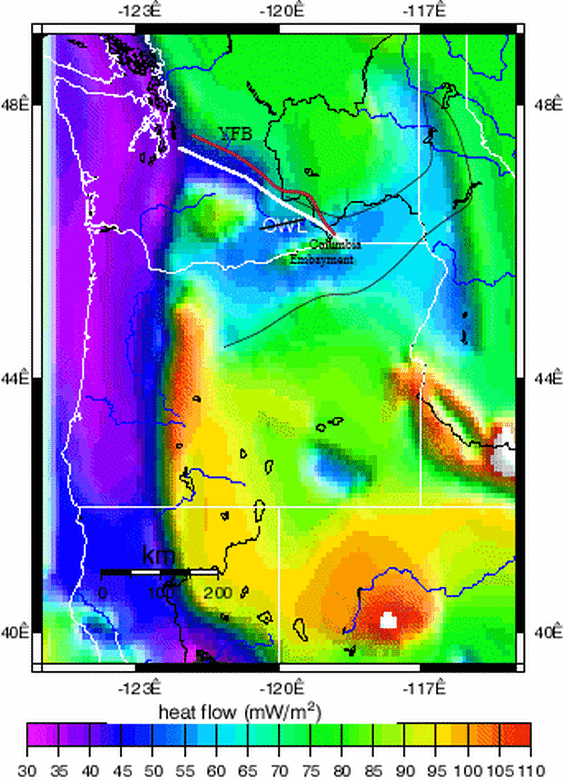
Figure 8c--Even the heat flow data shown above suggests that the OWL is not an accurate lineament in such data, but the YFB is, as noted in this broad heat flow map from Blackwell et al. 1992.
PART C--Nature of Seattle Fault and relation to Juan de Fuca plate geometry
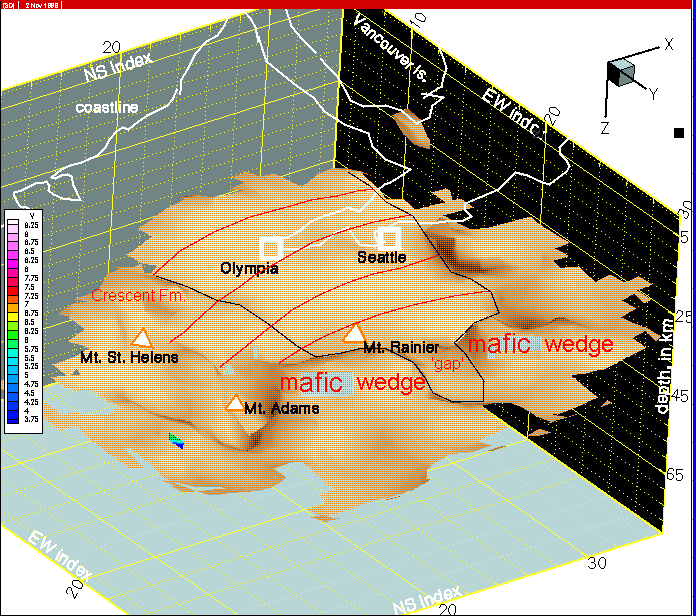
Figure 9a--More detailed view of JDFP arch and the 'gap' on its flank between sections of mafic wedge.
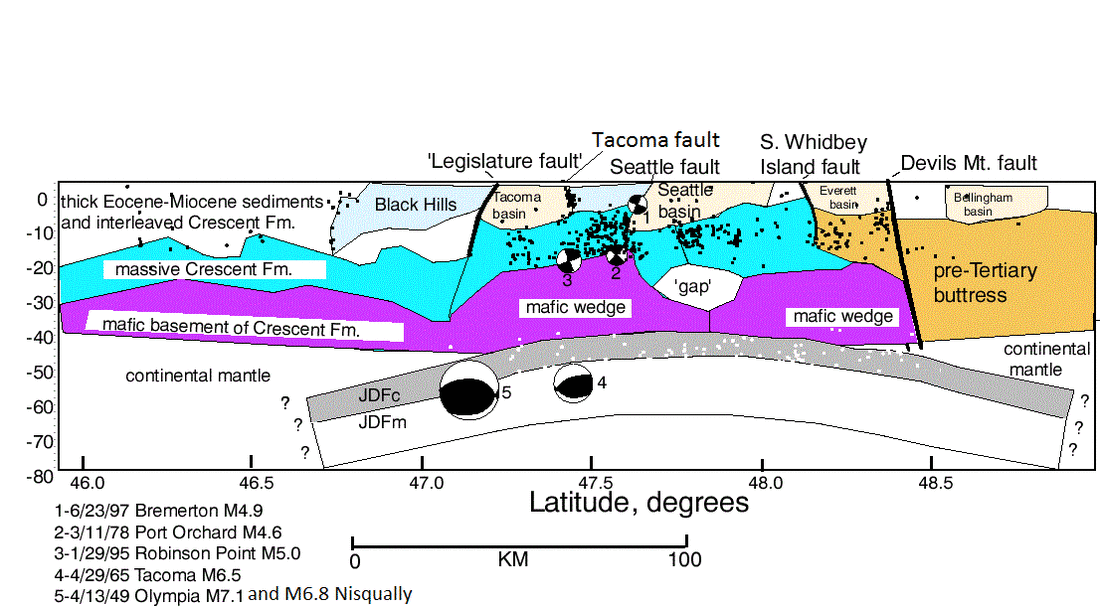
Figure 9b--North south cross-section derived from seismic tomography, magnetotelluric, and gravity data from Stanley, Villasenor, and Benz(1999). The 'gap' between sections of mafic wedge is centered at depth below the Seattle Basin. The SFZ is shown to be a much more significant structure overall than the Tacoma and Legislature faults. Also the South Whidbey Island fault is not of the same tectonic significance as the Devils Mt. fault (DDMF) which forms the southern edge of the key pre-Tertiary buttress and southern Vancouver Island which backstops northward migration of Crescent basalt and underlying mafic wedge units.
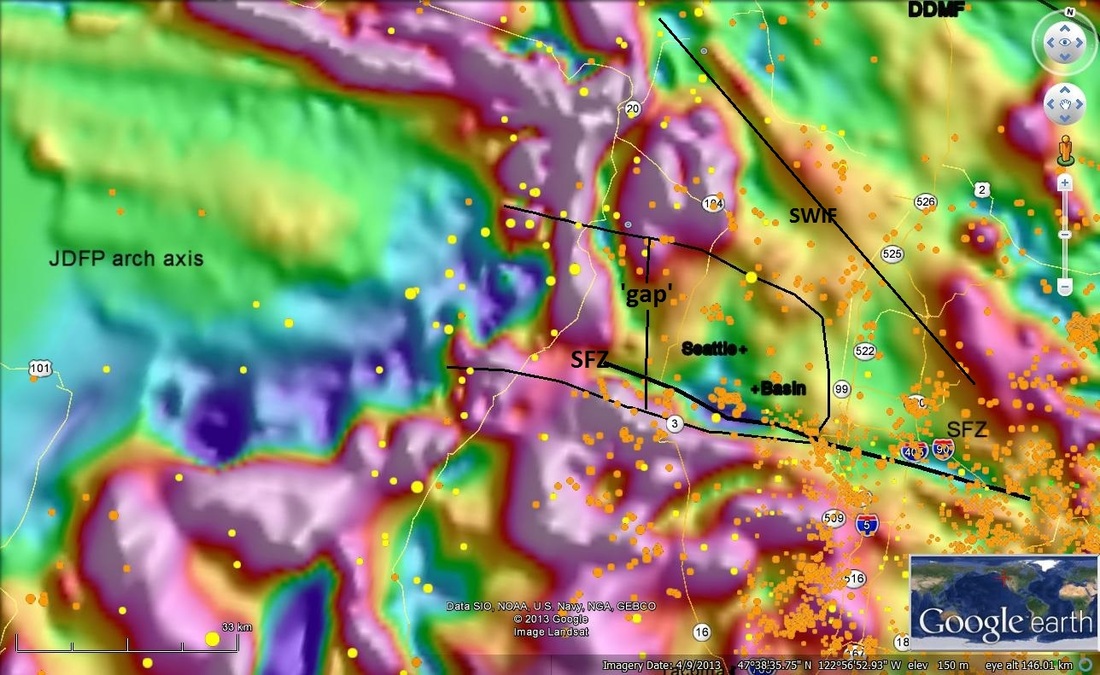
Figure 9c--Expanded view of aeromagnetic map in the Seattle Basin and 'gap' area. The two magnetic highs north and south of the 'gap' correspond directly to the sections of mafic wedge noted on the tomographic derived section in Fig. 9a. The location of the South Whidbey Island fault shown in relation to the aeromagnetic anomalies indicates further control of area faults by mafic materials. Also of probable significance are the axial ridges (with some associated lows evident without reduction to magnetic pole) on the aeromagnetic data in the JDFP arch and possible connection to the western end of the Seattle fault and basin. Lamb et al. (2012) has outlined a possible western SFZ strain transfer zone that may be related to such deep connections. See figure just below where the Lamb et al. transfer zone occurs at the 'head' of the 'gap'.
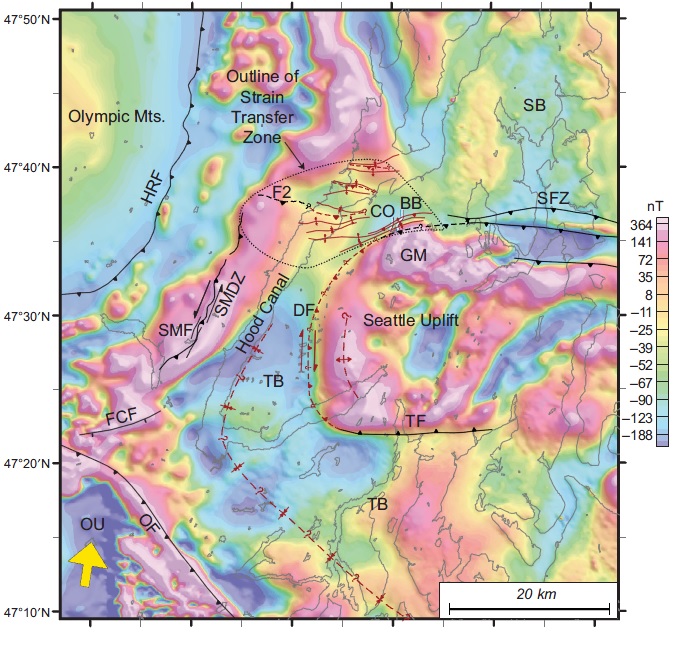
Figure 9d-- (figure and caption reproduced from Lamb et al., 2012)-- Summary interpretation of the western portions of Seattle fault zone. Rainbow colors indicate reduced-to-the-pole magnetic anomaly field intensity. The yellow arrow shows the regional direction of strain relative to North America (Mazzotti et al., 2002; McCaffrey et al., 2007). Solid black lines show previously mapped faults; structures introduced in this paper are in red. The two blue lines represent the location of the Coho Road(CO) and Big Beef Road (BB) seismic lines. DF—Dewatto fault; F2—thrust fault (Figs. 3, 6, and 7); FCF—Frigid Creek fault; GM—Green Mountain; HRF—Hurricane Ridge fault; OF—Olympia fault; OU—Olympia uplift; SB—Seattle Basin; SFZ—Seattle fault zone; SMDZ—Saddle Mountain deformation zone as interpreted from magnetic data (Blakely
et al. 2009); SMF—Saddle Mountain East and Saddle Mountain West faults; TB—Tacoma Basin; TF—Tacoma fault.
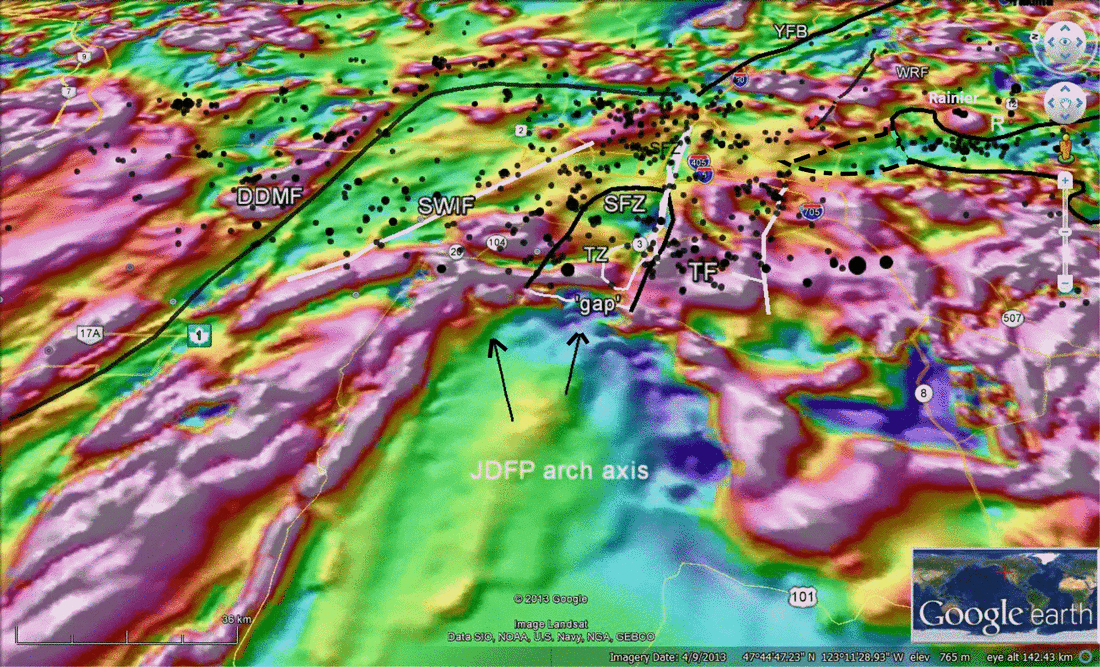
Figure 9e--Alternate view to the east of the JDFP arch axis, the 'gap', and the Lamb et al. (2012) Transfer Zone (TZ). This view would seem to strengthen the possible connection of the TZ and other features of the SFZ and Seattle basin to the JDFP arch axis and 'gap' between the mafic units just above the JDFP which define the Seattle basin. The nature of the structures depicted in this illustration seem to suggest that a Seattle fault episode could be directly triggered by motion in the nose of the plate arch, where a large amount of episodic tremor occurs during each 12-14 month cycle. This implies that the Seattle fault is a much more dangerous structure than any of the other faults depicted in the illustration. And paleoseismic data support this concern as well.
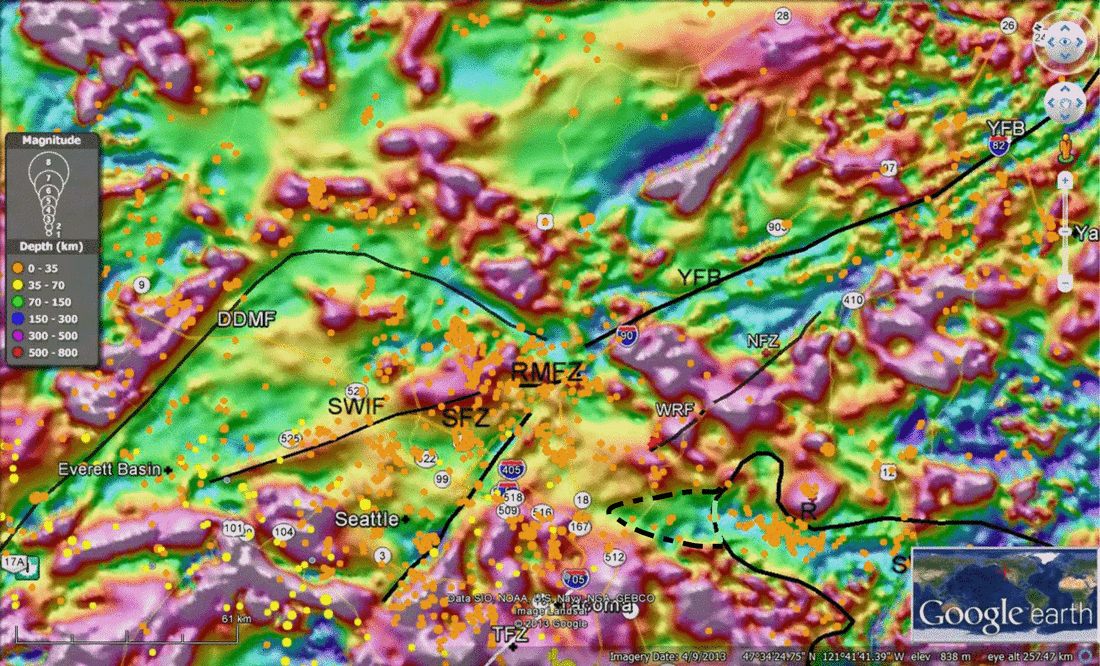
Figure 9f--Another view of the region of intersection of DDMF, SFZ, SWIF and YFB that includes the Rattlesnake Mt. fault zone (RMFZ) as described by Dragovich et al., 2009, from the Washington DNR. R=Mt. Rainier. Longer time span (and denser patterns) seismicity is shown in Figures 13 and 14 below.
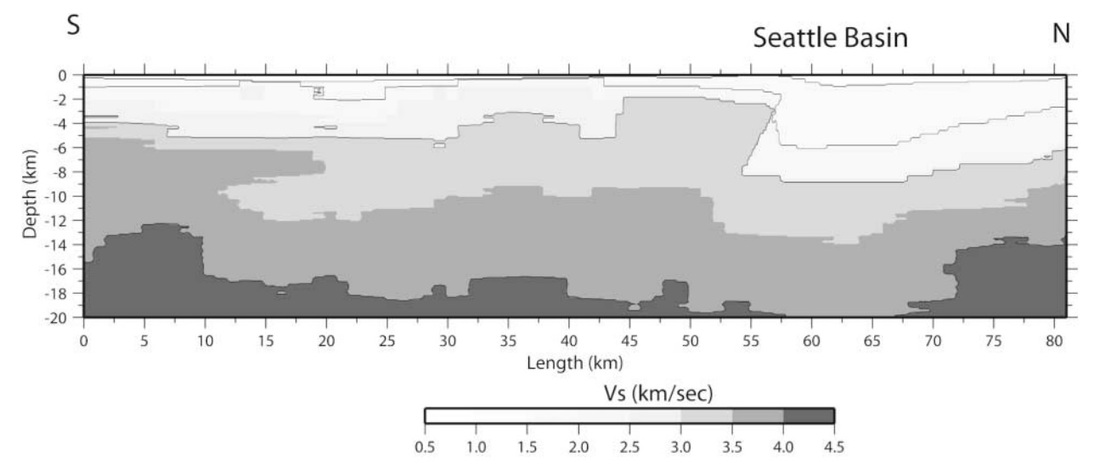
Figure 10--Local earthquake tomography model derived by Pitarka et al. (2004). Results are almost identical for the upper 20 km to the more gross models of Stanley, Villasenor, and Benz (1999) shown above.
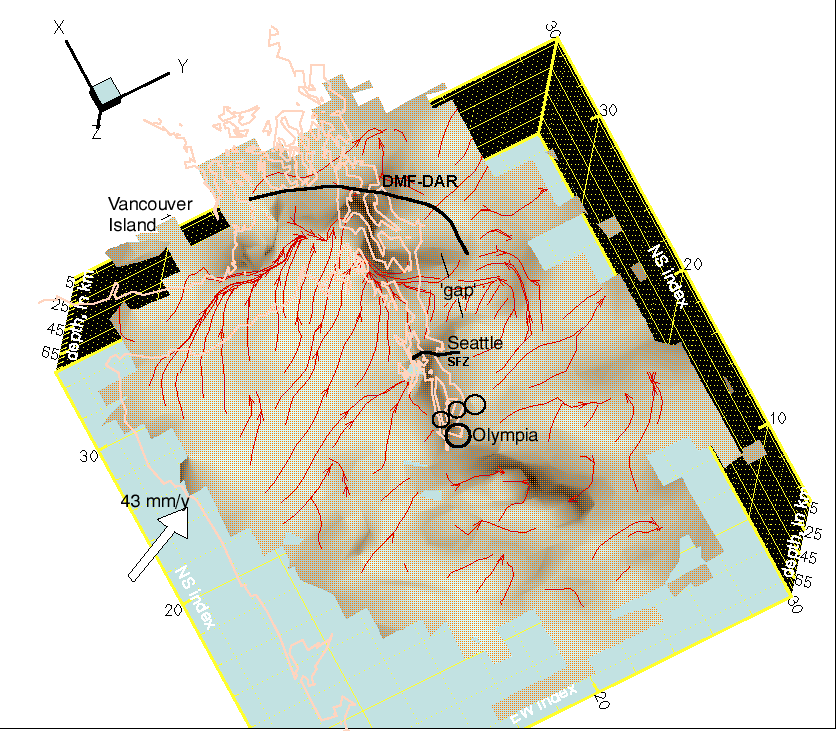
Figure 11a--Overhead view of detailed JDFP tomography. Red lines are directions that fluids would move on top of the 7.5 km/s surface that corresponds to the top of the subducting JDFP. Most of the directions on the arch part of the surface are in line with the direction of subduction (shown by white arrow). The 'gap' below the Seattle basin shows a variation to the primary NE direction. Circles in the Olympia area show the group of plate top seismic events, such as the 2001 Nisqually M6.8 quake.
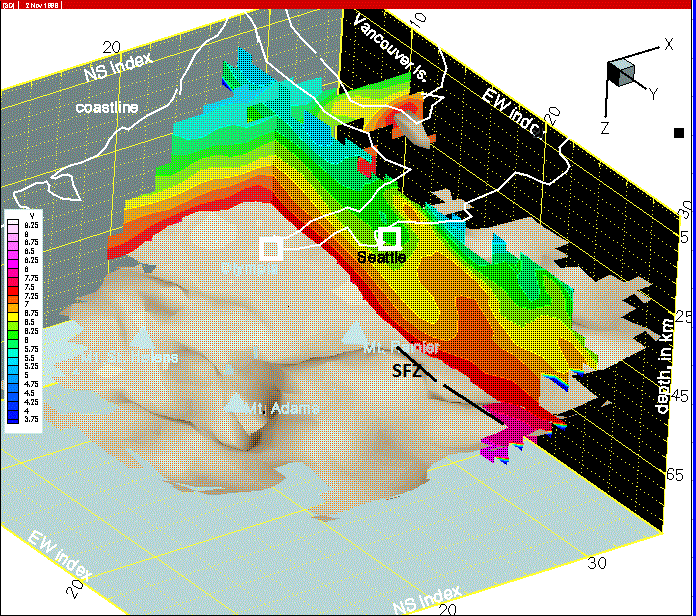
Figure 11b--Another view of 7.5 km/s isosurface from tomography with a velocity section extending downdip along the JDFP arch and then through 'gap' which defines the Seattle Basin and Seattle fault zone. Because of the the slanted 3D view from the southeast, the locations of the three Cascades volcanoes are indicated above the deep isosurface.
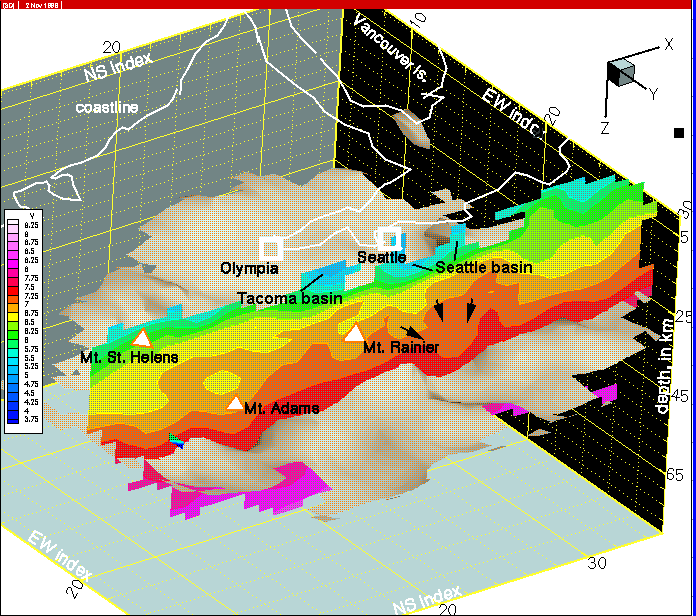
Figure 12--Same isosurface as shown in Fig. 11b with a north south velocity slice through the center of the Seattle Basin.
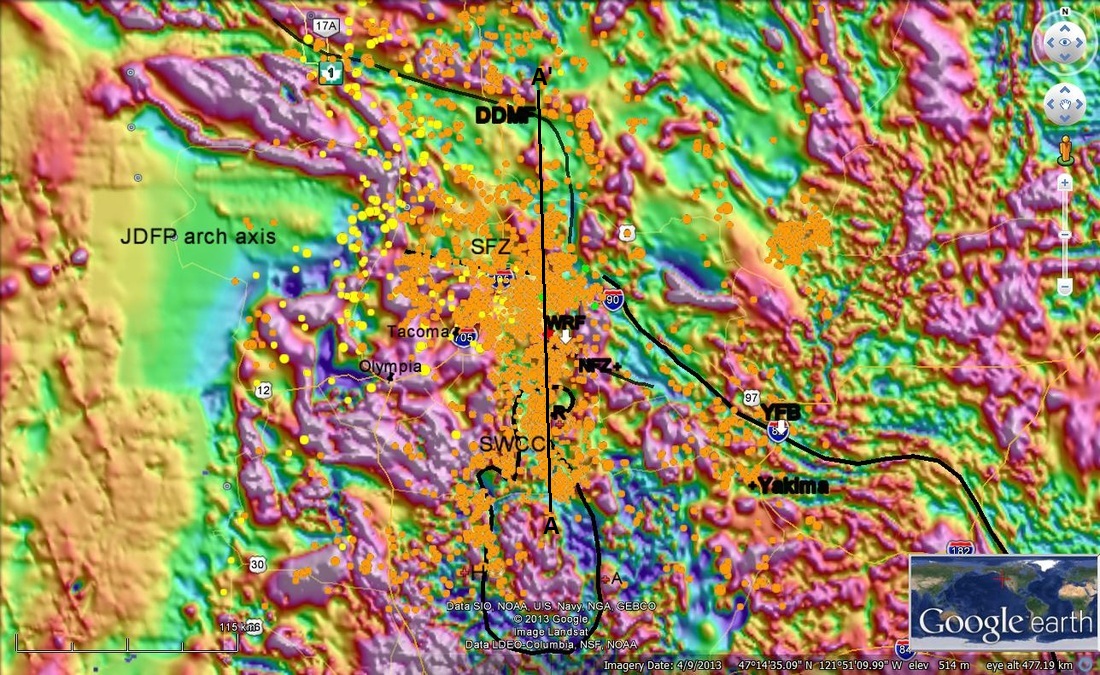
Figure 13--Broad, overhead view of regional aeromagnetic data with earthquakes plotted. Note the dense pattern along the WRZ and the SHZ at eastern and western margins of the SWCC. Also of interpreted significance are the axial magnetic ridges on the JDFP arch axis pointing toward the 'gap' and the Seattle fault zone. AA' is a cross-section profile shown in Fig. 15a. This connection can also be viewed in Figure 9a.
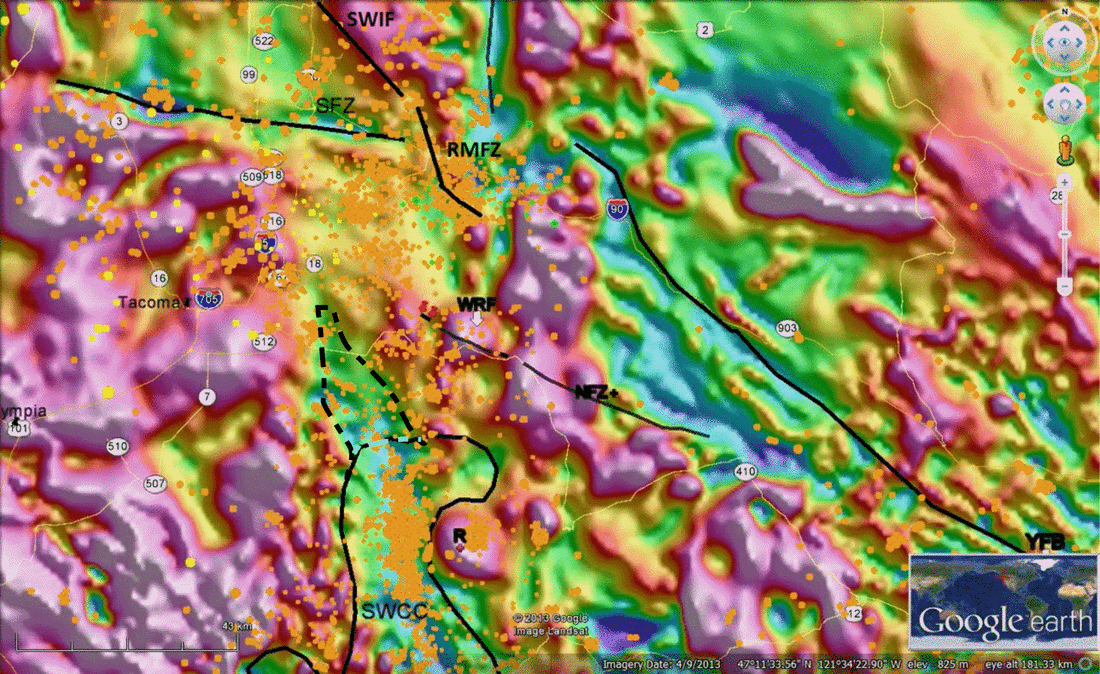
Figure 14--More detailed view of Fig. 13 focused upon the Seattle fault zone. For the most part seismicity patterns follow a north south concentration (WRZ) that is well defined in the northern part of the SWCC just west of Mt. Rainier (R). RMFZ=Rattlesnake Mt. fault zone, SWIF=South Whidbey Island fault zone. Near the east turning truncation of the SWCC, this seismicity of the WRZ turns to the east and thins out. The patterns becomes somewhat denser near Enumclaw along Hwy 410, but as the SFZ is neared, the pattern becomes dense again and somewhat aligned along the south side of the SFZ's east end where three major features almost intersect. These three tectonic elements are the SFZ, the YFB (Yakima fold belt), and the DDMF. Also, the relatively local RMFZ seem to concentrate some of the seismicity in this junction area.
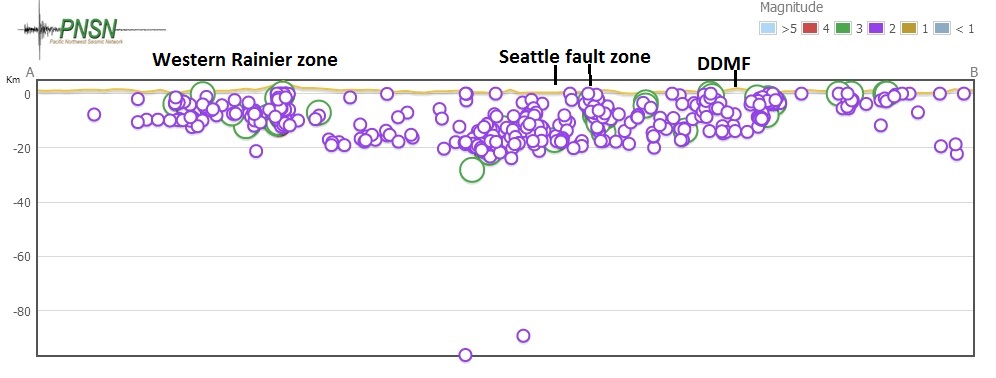
Figure 15a--Seismicity cross-section down axis of WRZ and across eastern SFZ, location shown as AA' in Fig. 13. A subset of the data shown in Fig. 13 was used with magnitude scale used for events. Note that seismicity dips down to the north along the WRZ and almost dies out until a much denser pattern occurs near the SFZ with events from shallow to deep. A separate pattern seems to be associated with the NS entry of the DDMF and slightly larger events until the pattern diminishes to the north.
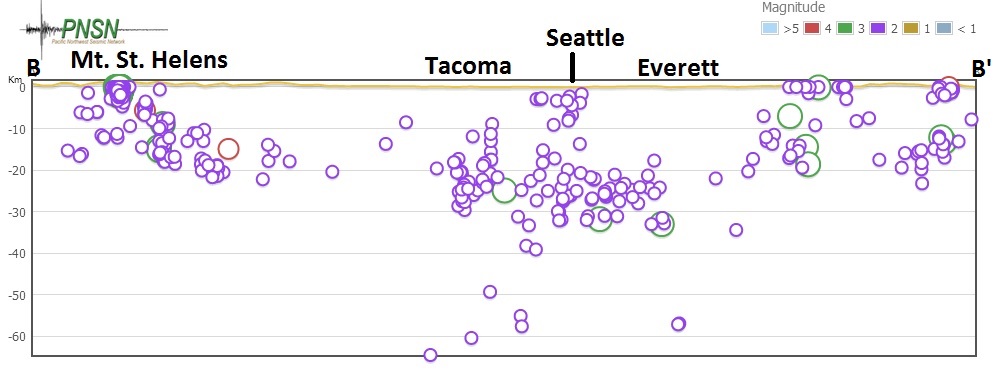
Figure 15b--NS seismicity cross-section through Mt. St. Helens and downtown Seattle.
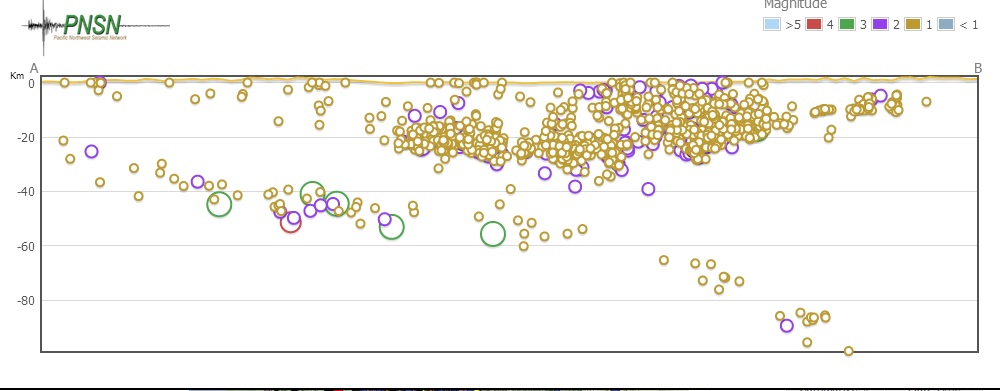
Figure 15c--EW seismicity section through Seattle fault south strand.
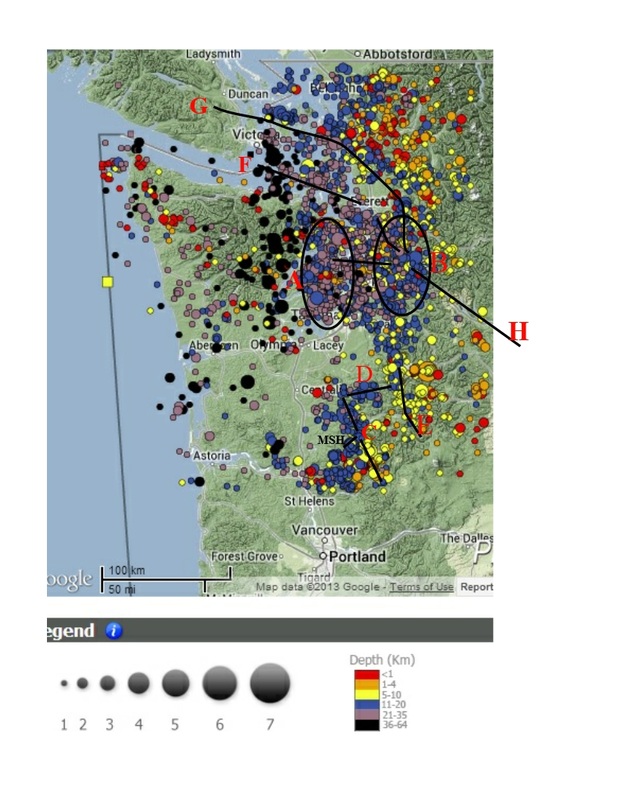
Figure 16a--Another plot of Washington seismicity designed to outline the key features in a final summary. Area 'A', as shown on the cross-section in Fig. 16b below contains events associated with the Siletzia rocks in the two blocks just north and south of the Seattle fault and forming the boundary of the Seattle Basin. Area B is the area of conjunction of the DDMF (G), the SWIF (F), the RMFZ, and the YFB (H) where non mafic units in migrating pieces of allocthonous or autocthonous crust become stacked against the nose and curving boundary of pre-Tertiary north Cascades crust. These events extend from the surface down to the base of this stacked crust. The DDMF is the locus of a definitive trend of events in the area north of the conjunction area. In the Cascades, C is the SHZ, D is the stepover zone between the north end of the SHZ and WRZ. Seismicity in the WRZ extends in a NS dextral slip zone up into the region of the stackup seismicity of area B.
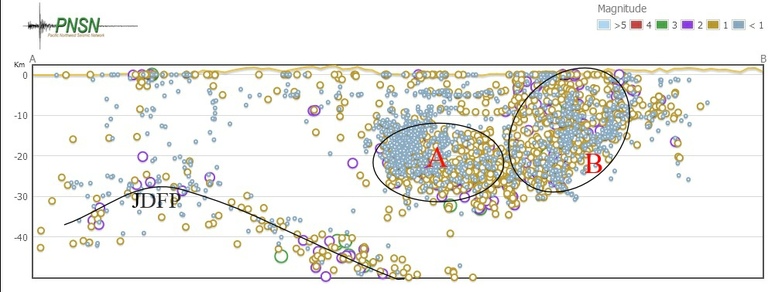
Figure 16b--Seismicity cross section through the area just south of the Seattle fault. Area A is associated with the underlying mafic rocks mapped with aeromagnetic, seismic tomography and MT data and the pattern dips down paralleling the subducting JDFP. Area B encompasses the stacked up pieces of unknown crust that are backstopped against pre-Tertiary crust at the intersection of the DDMF, SWIF, RMFZ, and YFB.
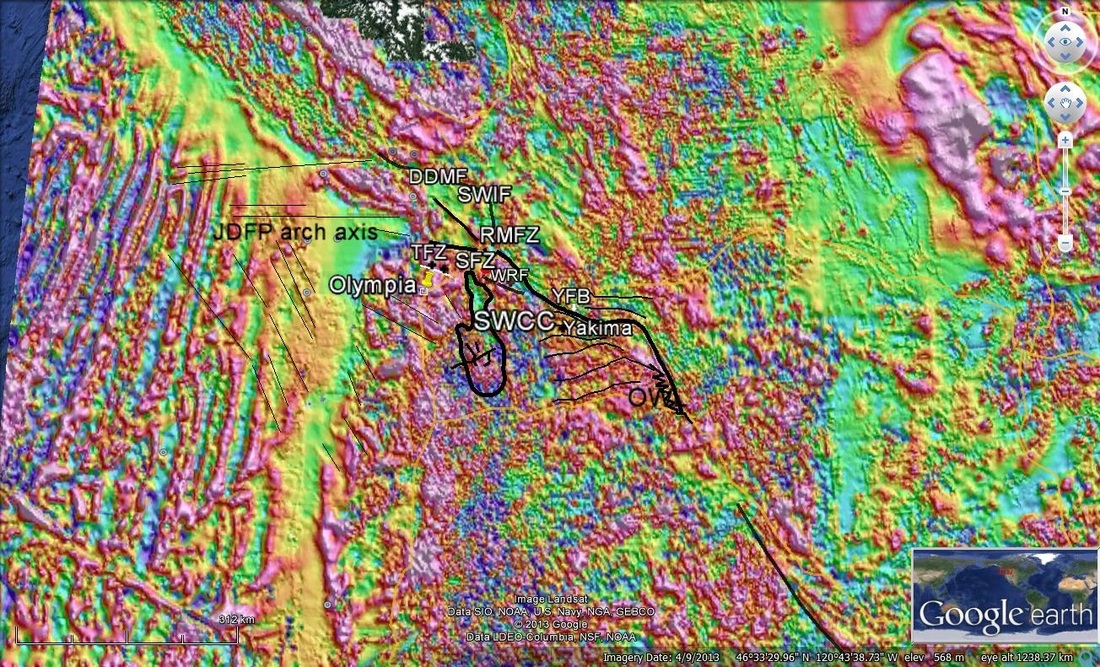
Figure 17a--As a final summary of the interacting tectonic features of the Cascadia subduction zone region, a broad look at the National Magnetic Data base is most useful of all. In addition to previous features discussed, such as the YFB and SFZ that are made clearer by the magnetic data, extremely important features of the subducting JDFP have been noted. The pattern of spreading ridge anomalies extending NNE from the Gorda Plate boundary is fairly regular in orientation and spacing. However, there are two other pattern features that have large significance to understanding the documented stress release around the Olympic Peninsula and JDFP plate arch area. A set of NW trending fractures or offsets occurs from the central Oregon coast ranges outward and affecting even the Siletzia complex in the Black Hills south of Olympia. Also, there is a set of EW features that may represent shear extending westward from the end of the SFZ. A blowup of the area around the Olympics is shown in Figure 17b below.
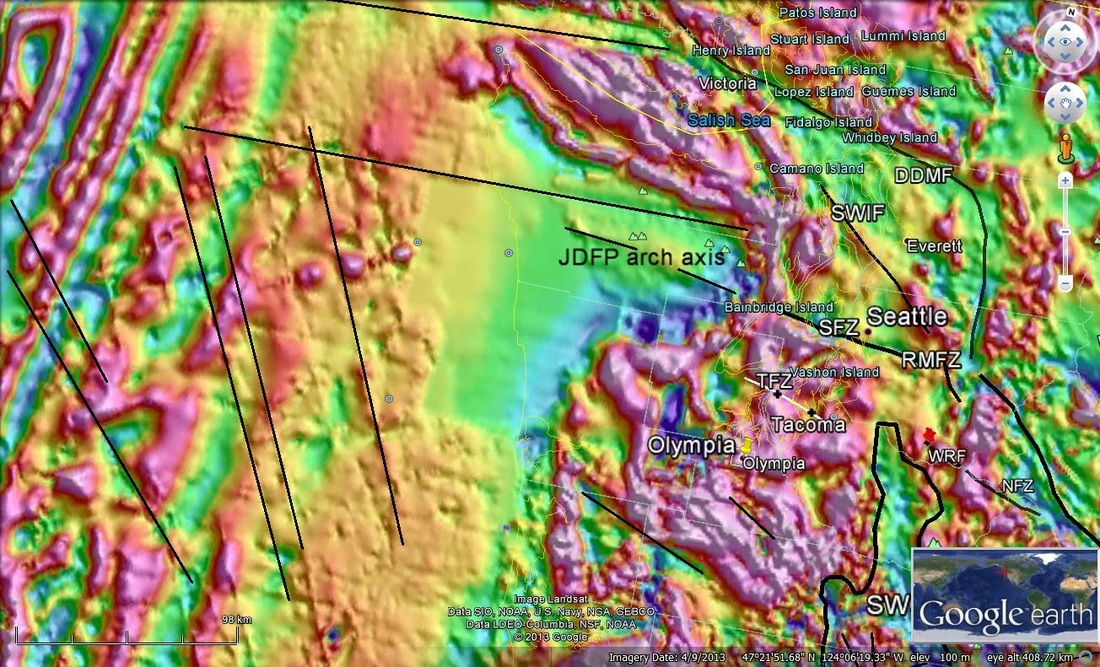
Figure 17b--Magnetic data around the Olympic Mts and JDFP plate arch region.
APPENDIX--More Details on White River Fault
Tabor et al. (2000) produced the latest and most complete map of the region encompassing the 'White River Fault' (WRF) as part of their synthesis of the Snoqualmie 1:200,000 quadrangle. Their cross-sections AA' , BB', and CC' are shown unmodified below. Below these we show simplified cross-sections that seem to be compatible with the surface geology, since we can find no reports which document actual fault motions on the WRF. We hypothesize that the contact of Fife's Peak formation units on the southern ends of the profiles with the more northerly Ohanapecosh units. The difficulty presented by dense ground cover is immense in this region. On the Google Earth view of Boise Ridge above in Fig. 5 the relationship between the two units where the WRF location is shown undashed in most maps seems to be clearly a mild overriding of the Fife's Peak on top of the the Ohanapecosh caused by arching upward of the region between the White and Green River drainages. But possibly geophysical studies and more detailed ground geologic investigation can prove whether this hypothesis is true. We will attempt to conduct key geophysical investigation in the key areas during the next year.
Tabor et al. (2000) AA' and BB' original cross-sections below
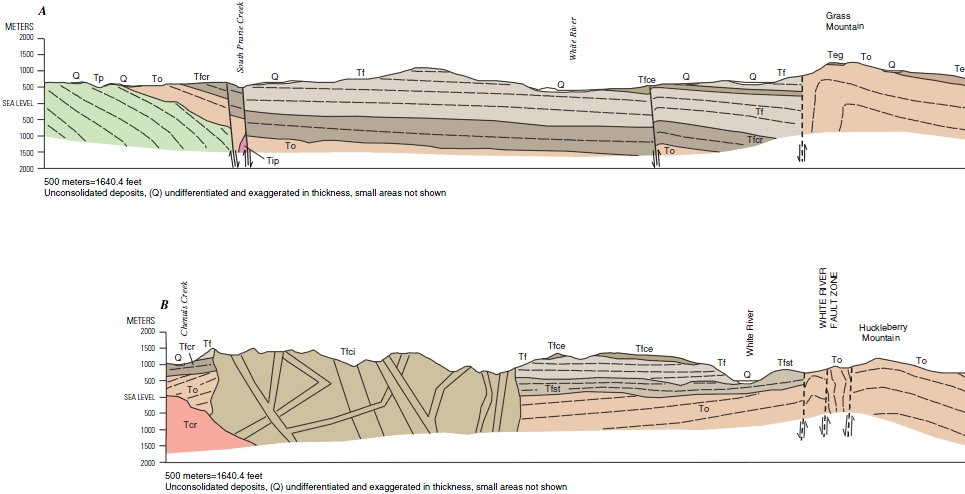
Figure 16--Original cross-sections across the White River fault zone from Tabor et al. (2000). On AA' Ohanapecosh units on the north side (right end) are indicated as severely bent down against Fifes Peak units on the south (left). On profile BB' offset is minimal in Ohanapecosh units at the proposed White River fault.
Modified cross-section AA' and unmodfied BB"
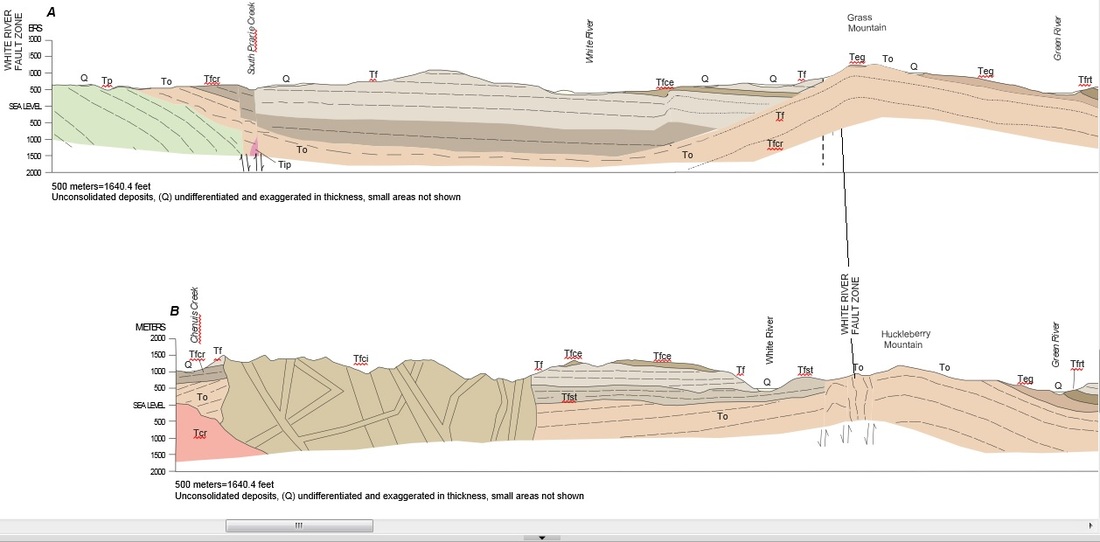
Figure 17--Our modified version of section AA' and unmodified version of BB" at the same scale. We have shown Fifes Peak units to be thrust northward against an arch in the Ohanapecosh units. This arch is indicated on maps of the region and in the cross section BB.
Unmodified section CC'
Modified section CC'
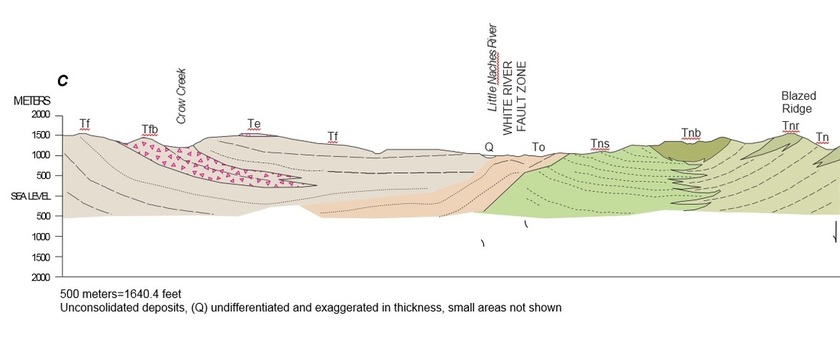
Figure 18--Unmodified cross section CC' from Tabor et al. above and our modified reconstruction below. We currently are searching for older publications or current field evidence that our modified section is not compatible with this evidence.
REFERENCES
Blakely, R. J., B. L. Sherrod, C. S. Weaver, R. E. Wells, A. C. Rohay,
E. A. Barnett, and N. E. Knepprath (2011):
Connecting the Yakima fold
and thrust belt to active faults in the Puget Lowland, Washington,
J. Geophys. Res., 116, B07105, doi:10.1029/2010JB008091
Dragovich, J.D., Anderson, M.L., Walsh, T.J., Johnson, B.L., and Adams, T.L. (2007).
"Geologic map of the Fall City 7.5-minute quadrangle, King County,
Washington", Washington Division of Geology and Earth Resources Geologic
Map GM-67, scale 1:24,000, with 16 p. text.
Lamb, A. P., L.M. Liberty, R.J. Blakely, T.L. Pratt, B.L. Sherrod and K. van Wijk, 2012:
Western limits of the Seattle fault zone and its interaction with the Olympic Peninsula, Washington,
Geosphere 2012;8;915-930.
Mazzotti, S., Dragert, H., Hyndman, R.D., Miller, M.M., and Henton, J.A., 2002:
GPS deformation in a region of high crustal seismicity: N. Cascadia forearc: Earth and Planetary Science Letters, v. 198, p. 41–48, doi:10.1016/S0012-821X(02)00520-4.
McCaffrey, R., Qamar, A.I., King, R.W., Wells, R.E., Khazaradze, G., Williams, C.A., Stevens, C.W., Vollick, J.J., and Zwick, P.C., 2007:
Fault locking, block rotation and crustal deformation in the Pacific Northwest:
Geophysical Journal International, v. 169, p. 1315–1340, doi:10.1111/j.1365-246X.2007.03371.x
Nelson, Alan R., Harvey M. Kelsey, and Robert C. Witter, 2006:
Great earthquakes of variable magnitude at the Cascadia subduction zone
Quaternary Research 65 (2006) 354–365
Pitarka, A., R.Graves, and P.G. Somerville (2004):
Validation of a 3D velocity model of the Puget Sond region based on modeling ground motion from the 28 February 2001 Nisqually earthquake. Bull. Seism. Soc. Am.94, 1670-1689.
- Raisz, Erwin (1945), "The Olympic-Wallowa Lineament", American Journal of Science, 243-A (Daly Volume): 479–485
Stanley, W. D., Villasenor, A., and Benz, H. D., 1999,
U. S. Geological Survey Open-File Report 99-311 On-line Edition, Subduction zone and crustal dynamics of western Washington: A tectonic model for earthquake hazards evaluation.
Tabor, R. W., V.A. Frizzell, Jr., D.B. Booth, and R.B. Waitt,2000,
Geologic map of the Snoqualmie Pass 30 x 60 minute quadrangle, Investigations Map I-12538, Reston, VA: U. S. Geological Survey, Reston, VA.
LIST OF INFORMAL RESEARCH WEB SITES
Western Washington Tectonics and Faults
http://pugetlowlandseismicity.weebly.com
2014 Oso, Wa Landslide
http://ososlide.weebly.com
brawleyquakes
http://brawleyquakes.weebly.com
cascadiageophysics
http://www.cascadiageophysics.com
imishmashStHelens
http://imishmashsthelens.weebly.com
Tectonic Background for Washington State Earthquakes
http://tremorandtectonicswashington.weebly.com